
Blue Apron has been one of the better-known consumer tech startups in the US. For $60 a week, it sends you a high quality meal-kit with artisan ingredients and recipes. However, investors seem to be disinterested in this company’s IPO, with Blue Apron slashing its target IPO price by 35% only 1 day before its listing. To add oil to the fire, our analysis of Blue Apron’s S-1 filing yielded insights that might be even more depressing for Blue Apron’s investors. Judging from their own numbers, Blue Apron doesn’t seem to have a viable business model.
Executive Summary
Our analysis of Blue Apron’s S-1 filing shows that the company has two fundamental problems with its business model.
- First, its customers have almost no life time value. It seems that Blue Apron loses more than 90% of its customers within 12 months of their first purchase, and has to continuously attract new customers to just sustain its revenue.
- Secondly, Blue Apron has no control over how much marketing dollars it has to spend to attract new customers. Our analysis shows that Blue Apron’s customer acquisition cost (“CAC”) has likely doubled in recent quarters compared to its level in 2015.
The implication of these two weaknesses is quite troubling. Because the value of each customer’s so small, Blue Apron has to acquire an immense scale just to reach profitability. However, reaching the said scale is extremely difficult because Blue Apron has to shell out so much to acquire customers that unfortunately abandon the service for good quite quickly. If this trend that we observed continues, Blue Apron may not even have a viable business worth any investor’s capital.
90% of Blue Apron’s Customers Abandon the Service After 1 Year
We based our analysis entirely on Blue Apron’s S-1 filings. Chief among them is the company’s cohort data, featured below. According to this chart, Blue Apron’s customer typically spends $410 in his first 6 months of using the service, another $196 in his second 6 months (for a total of $606 in 12 months) and another $119 in his third 6 month period (for a total of $725 in 18 months).

We can extrapolate this cohort data to measure Blue Apron’s customer retention. For instance, for a person to have spent $72 between the 30th and the 36th month, he must have spent about $12 per month. Repeating this exercise back to the cohort’s 1st month yields a relatively realistic picture of its monthly spending patterns and thus its retention rate. Shockingly, Blue Apron seems to retain only 11% of its customers after 12 month of their first purchase. Since long-term customers of many services tend to be power users with higher ticket sizes, this implies that Blue Apron actually loses even more than 90% of its customers within 12 months of their first purchase.
| Month | Cohort Cumulative Revenue | Cohort Periodic Revenue | Customer Retention Rate |
|---|---|---|---|
| 1 | 173 | 173 | 100% |
| 2 | 226 | 53 | 31% |
| 3 | 279 | 53 | 31% |
| 4 | 322 | 43 | 25% |
| 5 | 365 | 43 | 25% |
| 6 | 410 | 45 | 26% |
| 7 | 443 | 33 | 19% |
| 8 | 475 | 33 | 19% |
| 9 | 508 | 33 | 19% |
| 10 | 541 | 33 | 19% |
| 11 | 573 | 33 | 19% |
| 12 | 606 | 33 | 19% |
| 13 | 626 | 20 | 11% |
| 14 | 646 | 20 | 11% |
| 15 | 666 | 20 | 11% |
| 16 | 685 | 20 | 11% |
| 17 | 705 | 20 | 11% |
| 18 | 725 | 20 | 11% |
| 19 | 737 | 12 | 7% |
| 20 | 749 | 12 | 7% |
| 21 | 761 | 12 | 7% |
| 22 | 772 | 12 | 7% |
| 23 | 784 | 12 | 7% |
| 24 | 796 | 12 | 7% |
| 25 | 808 | 12 | 7% |
| 26 | 820 | 12 | 7% |
| 27 | 832 | 12 | 7% |
| 28 | 843 | 12 | 7% |
| 29 | 855 | 12 | 7% |
| 30 | 867 | 12 | 7% |
| 31 | 879 | 12 | 7% |
| 32 | 891 | 12 | 7% |
| 33 | 903 | 12 | 7% |
| 34 | 915 | 12 | 7% |
| 35 | 927 | 12 | 7% |
| 36 | 939 | 12 | 7% |
Blue Apron’s Customer Acquisition Cost Is Skyrocketing
Blue Apron’s filing also shows that it has been spending $94 on average to acquire 1 new customer from 2014 to 2017. Combining this data point with our findings above, we can triangulate roughly how many new customers the company acquired in each quarter, and rebuild how Blue Apron actually makes money from its different customer cohorts. Since we know how much revenue Blue Apron made in each quarter, we can then back into CAC & new customer figures that yields a correct revenue figure while also resulting in a 3-year average CAC around $94. Our own analysis below showed that Blue Apron’s CAC likely increased from $75 in 2015 to $163 starting in Q3 of 2016 to Q1 of 2017 (or $174 in Q1 2017).

Can Blue Apron Ever Be Profitable?
Now that we know how much it costs for Blue Apron to acquire a customer and how a customer typically behaves, we can estimate the company’s unit economics and assess whether it can be profitable. Here’s what we know from our analysis and the company’s filings:
What We Know…
- A customer spends about $606 in his first 12 months of using the service, after which he barely uses the service.
- With Blue Apron’s 31% gross margin, this translates to a 12-month gross profit of $190 per customer.
- If Blue Apron has to spend $175 in marketing to acquire this customer, it is effectively making only $15 of profit (or 2.5% of $606) before even considering other fixed costs like research & development or depreciation for its facilities. Do note, however, that the actual contribution margin is higher than 2.5% since some customers do shop with Blue Apron over a long period of time.
In comparison, Blue Apron’s R&D and D&A costs was 28% of its revenue in Q1 of 2017. Technically, Blue Apron can become profitable if it scales its business enough to lower this 28% significantly (R&D and D&A costs can’t grow forever). Just to get a sense of how big of a scale Blue Apron would need to be profitable, we’ve modeled out a hypothetical scenario with some generous assumptions to leave room for margin of safety:
ValuePenguin’s Assumptions
- We assume its gross margin expands to 35% (equal to that of Whole Foods) vs. its current gross margin of 31%.
- We assume its CAC to come down to $150.
- We assume its R&D and D&A decline to 17-18% of its revenue over time from its current level of 27%.
The result was quite startling. Even with these generous assumptions, Blue Apron has to acquire about 4.1 million new customers per year and make an annual revenue of $3.5bn just to break even (vs $800mn it made in 2016). To put that into perspective, Blue Apron has to convince 3% of fresh American households to try its service for the first time each year. Given that vast majority of its customers stop using the service after 1 year, Blue Apron may have churned through almost 20 million households by the time they start making some profit. That’s 16% of total households in the country that will have used Blue Apron at least once before the company becomes profitable.
| (in $ ‘000s unless otherwise stated) | 2014 | 2015 | 2016 | 2017* | 2018* | 2019* | 2020* | 2021* |
|---|---|---|---|---|---|---|---|---|
| Revenue | 77,806 | 340,803 | 795,416 | 1,188,601 | 1,827,458 | 2,506,910 | 3,239,600 | 3,697,725 |
| % Y/Y | 338% | 133% | 49% | 54% | 37% | 29% | 14% | |
| Gross Profit | 5,583 | 77,532 | 262,734 | 383,885 | 633,197 | 877,418 | 1,133,860 | 1,294,204 |
| % margin | 7% | 23% | 33% | 32% | 35% | 35% | 35% | 35% |
| Marketing Expense | 13,960 | 51,362 | 144,141 | 263,105 | 375,000 | 495,000 | 607,500 | 630,000 |
| % of rev | 18% | 15% | 18% | 22% | 21% | 20% | 19% | 17% |
| Other Operating Expense | 22,422 | 73,068 | 173,396 | 313,644 | 436,558 | 525,264 | 580,436 | 611,970 |
| % of rev | 29% | 21% | 22% | 26% | 24% | 21% | 18% | 17% |
| EBITDA | -30,188 | -43,981 | -46,586 | -174,306 | -149,884 | -107,991 | -15,985 | 91,780 |
| % margin | -39% | -13% | -6% | -15% | -8% | -4% | 0% | 2% |
| New Customers* (‘000s) | 215 | 685 | 1,251 | 1,698 | 2,500 | 3,300 | 4,050 | 4,200 |
| % Y/Y | 219% | 83% | 36% | 47% | 32% | 23% | 4% | |
| *These figures are our own estimates | ||||||||
Summary: A Questionable Business Model
In summary, we believe Blue Apron does not currently have a viable business model at hand to deserve its current valuation of $2bn. Its inability to control its customer acquisition cost, which is largely affected by competition, restricts its margins at a razor thin level. Consequently, it needs to acquire an unrealistic number of customers each year in order to be profitable because its customers are constantly abandoning the service and rarely coming back. The bull case for Blue Apron is that its competition dies out and its CAC declines meaningfully, allowing it to reach profitability at a smaller scale. However, such a scenario doesn’t seem all that likely with companies like Foodkick and with Amazon entering the fray to provide on-demand delivery of meal-kits from supermarkets.
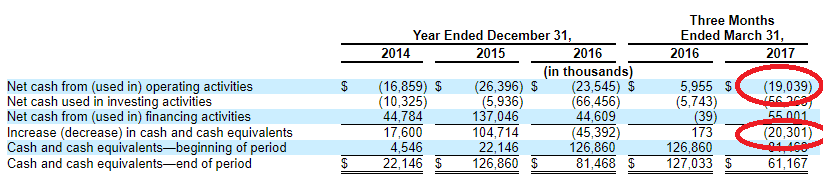
To exacerbate things further, Blue Apron is running out of cash. While it only has $60mn of cash and $150mn of debt on its balance sheet, it was burning $20mn in just 1 quarter. No wonder it is still going through with the IPO after the 35% cut in its valuation: they must be desperate for funding. Even if it raises $360mn from its IPO, does it really have the time to achieve scale and become profitable before it runs out of money?
Lastly, it’s important to note that Matthew Salzberg, the CEO of Blue Apron, has been selling his own shares since 2014 even while his sale price has been declining. In 2014, Mr. Salzberg sold his shares at $16.6586 per share, and again in October 2015 at $13.3269 per share. Now, they are listing at around $10. While it’s normal for insiders to cash out occasionally, it seems odd that he has been selling despite the fact that his sale price has been declining. An executive who is confident about his company normally buys his stock when its price declines.
Disclosure: I have no positions in any stocks mentioned, and no plans to initiate any positions within the next 72 hours. This article expresses only the author’s opinion. I am not receiving compensation for it. I have no business relationship with any company whose stock is mentioned in this article.
The article Blue Apron: Stay Out of the Kitchen originally appeared on ValuePenguin.
ValuePenguin helps you find the most relevant information to optimise your personal finances. Like us on our Facebook page to keep up to date with our latest news and articles.
More From ValuePenguin:
- Best Online Brokerages in Singapore 2017
- Average Cost of Online Brokerages in Singapore
- A Comprehensive Guide to Valuation and Investment Strategies
Source: ValuePen